Our Seniors
Our seniors (65 years or older) are everywhere in Belmont and a significant part of our community’s volunteering, living memory, culture and vibrancy. Many challenges seniors face are shared by all of us: crossing and pedestrian safety, access to local services, walkability of neighborhoods, access to health care, community events, social opportunities, learning opportunities and ability to move about safely without fear of being tripped, bumped, jostled or knocked over.
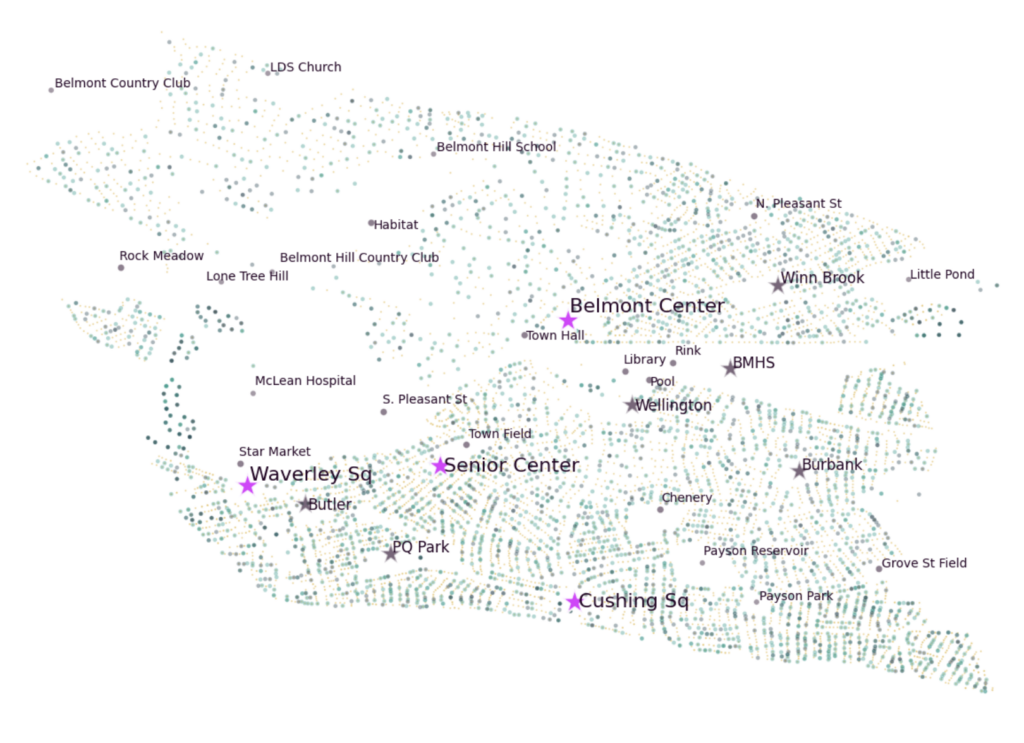
I looked at our town census and other public data1 to better understand our community, and how we might allocate services to serve our residents. The most obvious conclusion: our seniors live everywhere in Belmont. Each green dot in the map below represents at least one resident 65 years or older, and the darker green dots represent a resident at least 80 years old.
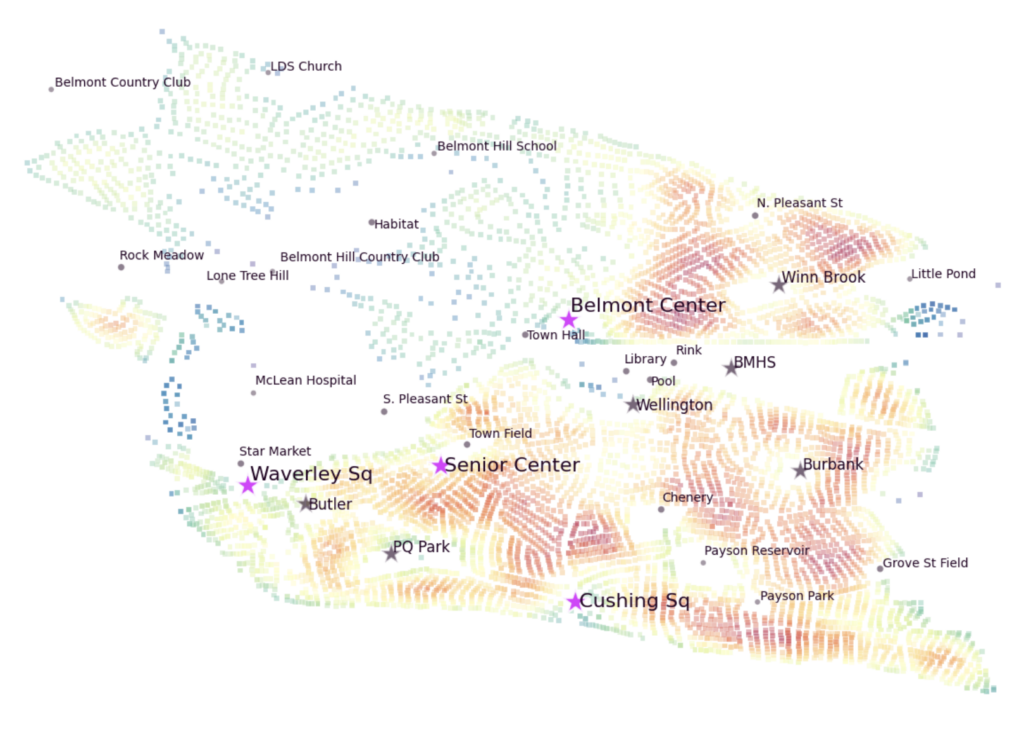
Belmont has neighborhoods with higher density than other areas. Below is a heat map of resident (adults only) density. Blue is lowest density and red is highest. Areas zoned for multi-family housing and smaller lot-sizes have significantly more adult residents (again: the data do not include children).
Where in Belmont are there a larger number of seniors living in close proximity to one other? A high-density of seniors (65+) show five clusters (red dots), all within high-density residential areas of town. Think of this map as “where in Belmont could I visit a lot of seniors at home while walking the shortest distance?”
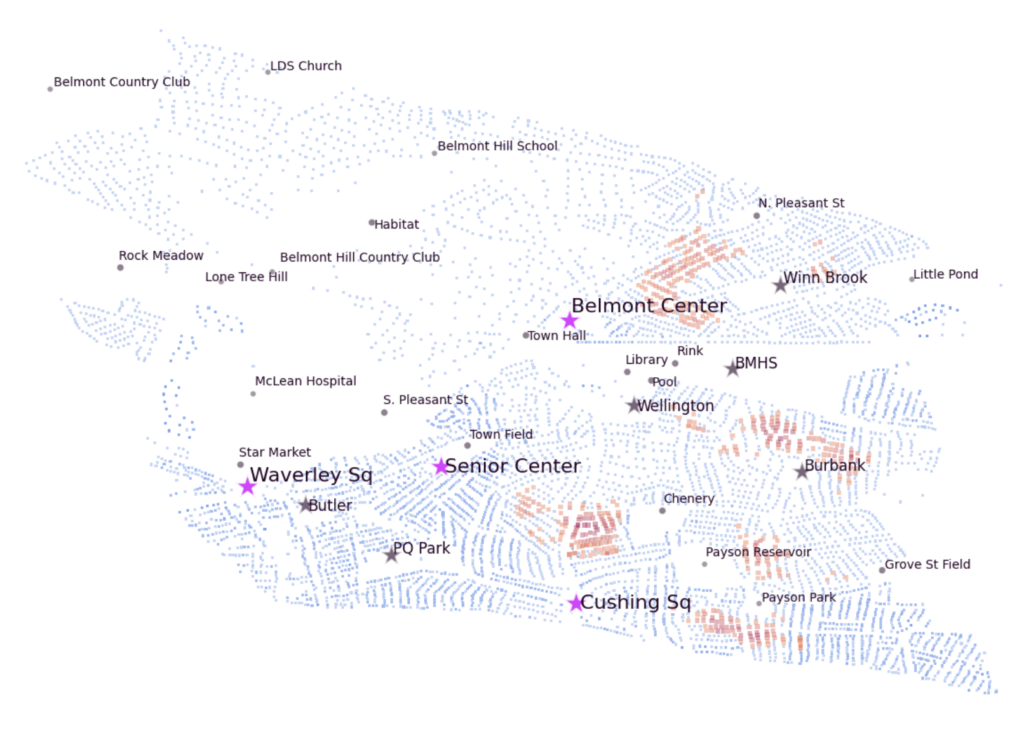
- Precinct 8, between Winn Brook and Pleasant St (with a mini-cluster area along Brighton St)
- Precinct 1, in single-family residential areas along Concord Ave, south of Clay Pit Pond
- Precinct 6, on the hillside between Payson Reservoir and School St
- Precinct 6 and 5, west of Chenery Upper Elementary and across Common St
- Precinct 6, about a block north of Belmont St along Fairview, Ave to the Benton neighborhood
Seniors outside of these clusters may experience even higher needs for mobility assistance, transportation, and access to social opportunities.
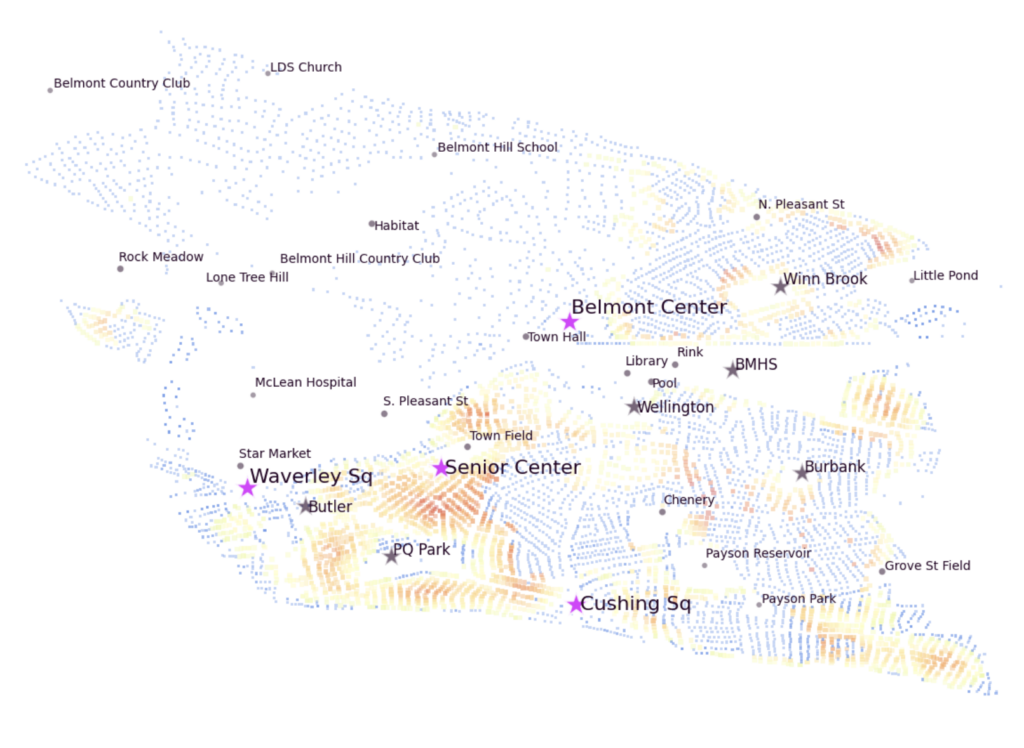
Which high-density residential areas have fewer seniors? These areas tend to be residential neighborhoods with more recent or frequent home sales, more rental units, and around schools, parks and other areas zoned for multi-family residences. All these residents share many of the same needs seniors experience: safety, access to services, walkability, and social opportunities. And recall the first map: seniors live everywhere in our community.
- These data are a good approximation despite significant limitations. In total, these data are a good picture of about 72% of our residents. They don’t include our more than 5,000 children. Several adult populations are under-represented in the data: residents with fewer resources, non-English speakers, non-voters, and renters are all under-counted. New residents are likely missing, and those who have left recently may still be included. About 15% of the adults are not represented.
↩︎